The Fiscal Year 2009 Budget is out! Yay!
It's a Pun Salad tradition
(because we've done it twice before, in 2005 and
2007) to produce
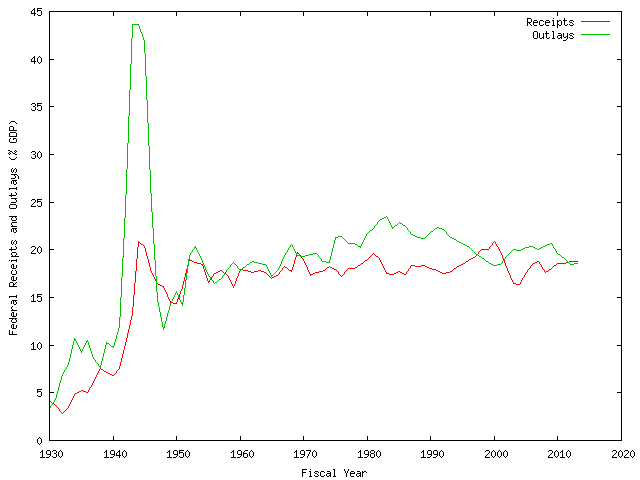
some simple graphs out of Table 1.2 ("SUMMARY OF RECEIPTS, OUTLAYS, AND
SURPLUSES OR DEFICITS (-) AS PERCENTAGES OF GDP: 1930-2013")
from the Budget's
Historical
Tables document.
Here is a graph
of that data since 1977; post-2007 numbers are estimates:
![[fed in and out]](/ps/images/fed2009/fed_inout_small.png)
Here's what that works out to in terms of deficit spending:
![[fed in minus out]](/ps/images/fed2009/fed_deficit_small.png)
Click on the graphs for their fullsize versions.
Data is here
and my Gnuplot script is here.
If you'd like to see the data extended back to 1930: here's the
receipt/outlays
graph and here's the deficit
graph.
As I said last year: if you're thinking this is simple-minded, you're
right. In my defense,
the percent-of-GDP seems appropriate
for historical comparison; it seems to be (arguably) a good measure
of what we can "afford"; and, if you believe
deficits
"damage the economy", then it's a pretty good proxy for the level
of damage.
I also have made these points before:
-
The overall trend in federal spending (by this measure), despite
bumps, seems
to be downward since 1983.
There are obvious increases under Dubya, but
(by this measure) they are not totally out of
historical whack.
-
Receipts bounce up and down, but they seem to center around the
18-19% range.
-
Hence the eyeball-trend on the deficit graph is also downward
since 1983.
For all the massive hoopla about spending and taxes over the past
couple decades, the interesting thing is the lack of strong
trends (as opposed to short-term blips) in the graphs.
Yes, taxes were historically high in the late 1990s, but they
came back down again. Yes, they were historically low early in this
decade, but they came back up again.
I almost wish I could be more cynical about this. For example, the
OMB predicts a
surplus in 2012. I hear you speculating, as I did: "Ha, I bet last year
they predicted a surplus would arrive in 2011!"
Nope. They predicted a surplus in 2012 last year too.
Similarly, the last "actual" numbers for outlays and expenditures
in the FY2009 budget are for 2007, when receipts were 18.8% of GDP
and outlays were 20.0% of GDP. Said cynical me: "Surely their
past estimates for 2007 were way too optimistic, lowballing
expenditures and overstating revenue."
Again, nope. In the previous four years, their estimates for receipts
2007 were below the 18.8% figure. They overestimated outlays
in the previous two years. There's not a lot of evidence to indicate a
persistent Pollyannism at the Office of Management and Budget.
That's not to say that this years budget is free of chicanery
and deceit. At Cato, Chris Edwards opines
on "Bush's Dishonest and Spendthrift Budget." (Major crimes: not
counting the "stimulus" being debated in Congress in the budget; only
looking at one year of AMT relief when it's clear that everyone thinks
an AMT fix should go beyond that.)
And—I've mentioned this before too—in the long term, beyond
the horizon of the OMB budget, entitlements are a ticking time bomb.
My favorite 50-year-old Harvard econ prof, Greg Mankiw, has a really good column on the topic, which you should read right
now.
(Other files available, if you're interested:
my Gnuplot script;
the data table used.)
![[Cathy
Poulin]](/ps/images/cathy_poulin.gif) Our web logs continually show that many, many people come here
looking for
Cathy
Poulin. Hence, we are today declaring Cathy to be
the unofficial (and, more important, unpaid)
mascot of Pun Salad.
Our web logs continually show that many, many people come here
looking for
Cathy
Poulin. Hence, we are today declaring Cathy to be
the unofficial (and, more important, unpaid)
mascot of Pun Salad.
![[Amazon Link]](/ps/asin_imgs/B000E8QVAQ.jpg)
![[4.0
stars]](/ps/images/40stars.gif)
![[IMDb Link]](https://ia.media-imdb.com/images/G/01/imdb/plugins/rating/images/imdb_46x22.png)
![[Amazon Link]](/ps/asin_imgs/B000YPUF9W.jpg)
![[2.5
stars]](/ps/images/25stars.gif)
![[Amazon Link]](/ps/asin_imgs/B000Y7U98C.jpg)
![[3.5
stars]](/ps/images/35stars.gif)
![[Amazon Link]](/ps/asin_imgs/B00005JPQE.jpg)
![[1.5
stars]](/ps/images/15stars.gif)
![[Amazon Link]](/ps/asin_imgs/B0017OGOIA.jpg)
![[Amazon Link]](/ps/asin_imgs/0425202887.jpg)
![[Amazon Link]](/ps/asin_imgs/B000WZAE1I.jpg)
![[3.0
stars]](/ps/images/30stars.gif)
![[Amazon Link]](/ps/asin_imgs/B00104AYSS.jpg)
![[I am Iron Man]](http://www.zipperfish.com/free/marvel/ironman.jpg)
![[destroy the computer]](/ps/images/computer.jpg)
![[fed in and out]](/ps/images/fed2009/fed_inout.png)
![[fed in minus out]](/ps/images/fed2009/fed_deficit.png)
![[SBIX Logo]](/ps/images/9_small.gif) Franco Harris made a bit of a stir in 1975's
Super Bowl IX. He
threatend to boycott because he deemed the game's logo to be "just way too
girly". But he relented, and went on to be named MVP as the Steelers crushed
the Vikings 16-6.
Franco Harris made a bit of a stir in 1975's
Super Bowl IX. He
threatend to boycott because he deemed the game's logo to be "just way too
girly". But he relented, and went on to be named MVP as the Steelers crushed
the Vikings 16-6.
![[Gentle Ben]](/ps/images/mankins.jpg) Patriots offensive lineman
Patriots offensive lineman ![[The Blogger and His Dog]](/ps/images/me_with_barney.jpg)


