Here's what Andrew Sullivan has to say today:
BUSH'S TAX INCREASES: They're inevitable. This president, who knows how to duck personal responsibility, may not have to preside over them. But his successor will be forced to. The Medicare explosion and Social Security crunch mean something obvious to anyone with eyes to see:
[B]aby boomers' children and grandchildren face massive tax increases. Social Security and Medicare spending now equals 14 percent of wage and salary income, reports Bell. By 2030, using the trustees' various projections, that jumps to 26 percent. Of course, payroll taxes don't cover all the costs of Social Security and Medicare. Still, these figures provide a crude indicator of the economic burden, because costs are imposed heavily on workers via some tax (including the income tax), government borrowing (a.k.a. the deficit) and cuts in other government programs.Bruce Bartlett, a conservative (or what used to be a conservative), has begin to think of how best to minimize the damage Bush is doing to the economy, and believes a VAT is the least worst option. My only point is that it is absurd to believe that this president has really lowered the tax burden. By spending through the roof, while cutting taxes, all this president has done is borrow. The debt will have to paid off, or inflated or devalued away. But before then, this president's big government spending will require either massive cuts in entitlements (which he has threatened to veto) or massive tax hikes. I have no confidence that either party will cut entitlements. Bush's domestic legacy is that he has made America safe for a vast expansion of government and taxation.
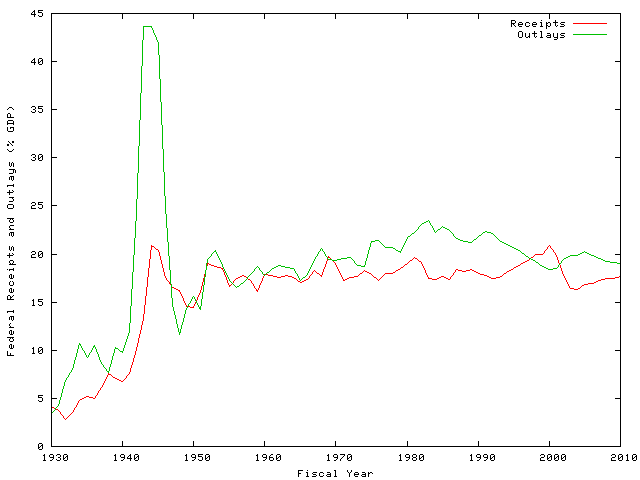
Eek, where to begin? I like graphs. Here's one I generated from the OMB's latest Historical Tables document showing Federal Receipts and Outlays since 1977 (Table 1.2).
![[Fed In and Out]](/ps/images/fed/fed_inout.png)
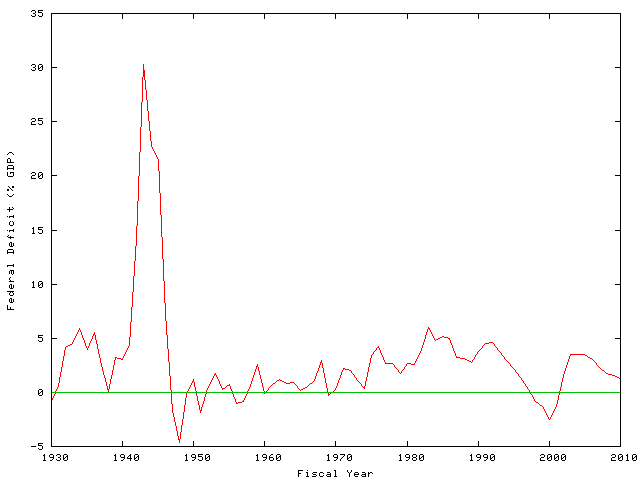
and here's what that works out to in terms of deficit spending:
![[Fed In Minus Out]](/ps/images/fed/fed_deficit.png)
(Click on the graphs for their fullsize versions. Data is here and my Gnuplot script is here.)
I'm graphing the numbers as percent-of-GDP here. That seems appropriate for historical comparison; also it's probably the best way to look at "damage to the economy". Numbers for 2005-2010 are estimates, by which you should probably read "guesses."
(And not that it matters: the data snipped from the appropriate Historical Table is here; a graph showing the receipts/outlays since 1930 is here; a graph showing the deficits since 1930 is here; the Gnuplot program I used for producing them is here.)
Relevant points:
- Bush really has cut taxes. Federal receipts went from 20.9%
to 16.3% of GDP between FY2000 and FY2004. That's the lowest it's
been since 1959.
- On the other hand, Sullivan's calling spending is "through the
roof" is unsupportable. FY2004 outlays are 19.8%, down a smidge from
FY2003 where they were 19.9%. That's a bigger chunk than 1997-2002,
but it's smaller than any year in the 1974-1996 period.
- (As a mostly-libertarian,
I'd like to think that both receipts and outlays
could and should be much, much, lower. But we're talking here about
reality and historical context.)
- The current deficit isn't that big a deal in terms of GDP. In
the time period graphed, the deficits were bigger in 9 out of
the 34 years.
Can you look at these graphs and seriously claim that Bush (all by his lonesome, apparently) "has made America safe for a vast expansion of government and taxation"? Sorry, but I just don't see it. Bad as Bush's spending increases are, they just aren't that far out of historical whack.
Entitlements are a ticking time-bomb for the long term, of course. But blaming Bush solely for the current failure to engage that problem seriously is just ignorant.
Sullivan's Bush-hatred is well-known, and his finger-pointing will only be persuasive to his fellow haters. Bush is at least making an effort at entitlement reform, and more of an effort than he really has to; most Democrats (and some Republicans) are singing a comforting refrain: no current crisis, only minor adjustments needed, la-de-dah.
But that's beside my real point. Look at the graphs, and ask yourself: where do you want the lines to go? What percent of GDP do you think the Feds should be spending in (say) 2030?
Let's ignore, for now, the issue of what they should spend on: entitlements, defense, edyookation, … Fight about how to cut the pie after we decide how big it is. Similarly, ignore the issue of where the money comes from; we can also debate that after it's decided what the target is.
That's a simple question, but it's not simplistic. I'd rather this "simple" question got debated openly before anything else; once we've figured that one, we can tackle the "sophisticated" ones.
Point your finger all you want, Sully, but this is a democracy: the finger should really always point back at us.
![[The Blogger and His Dog]](/ps/images/me_with_barney.jpg)


